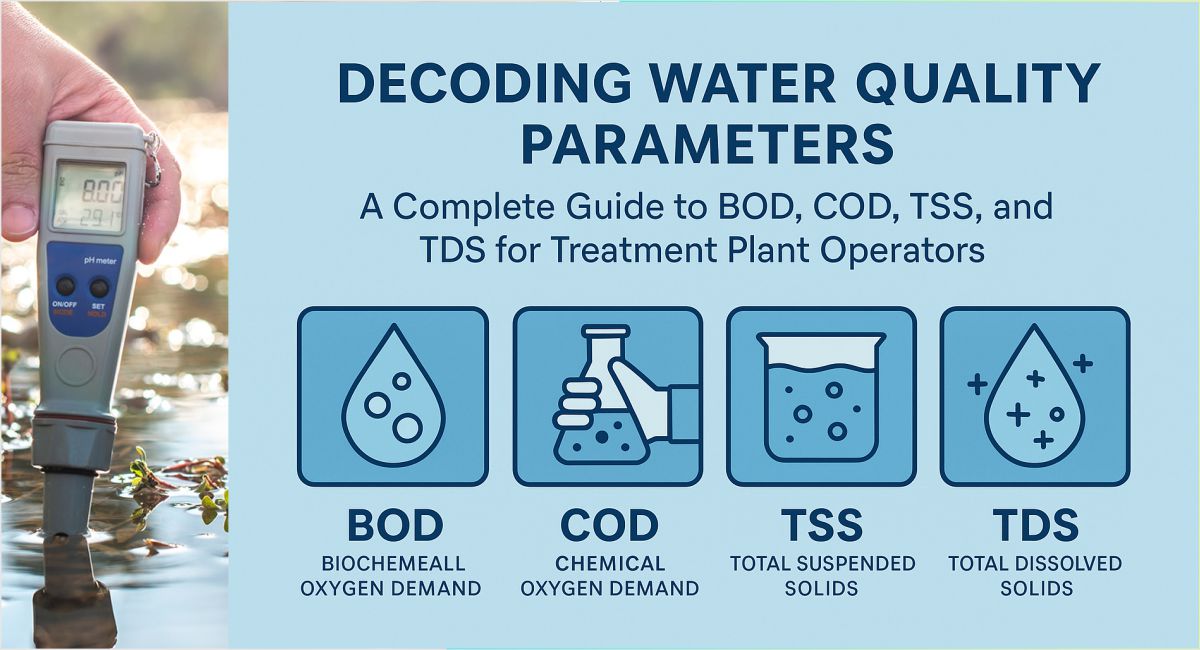
How to Optimize Wastewater Treatment Efficiency Using Key Metrics
Treatment plant operators are under a lot of pressure. They must meet strict standards while keeping costs low. Knowing about BOD, COD, TSS, and TDS is key to making good decisions.
This guide seeks to educate readers on water quality parameters utilized in waste treatment and designed to offer actionable insights that will empower them to successfully manage, measure, and interpret the wastewater parameters relevant to their operations.
Why Water Quality Parameters Matter
The High Stakes of Parameter Management
Improper monitoring and management of water quality can cause big problems. Untreated wastewater harms aquatic life, leading to fish deaths and damaged habitats. High levels of TSS damage equipment, lower treatment efficiency, and raise costs.
These issues can lead to fines, plant shutdowns, and harm to a plant’s reputation.
For treatment plant operators, measuring water quality accurately is key. It affects:
- Treatment process optimization
- Energy consumption
- Chemical usage efficiency
- Equipment lifespan
- Effluent quality for discharge or reuse
With stricter regulations and less water, mastering these parameters is crucial. It ensures sustainable plant operation.
Technical Breakdown of Key Parameters
Understanding BOD: The Biological Activity Indicator
Biological Oxygen Demand (BOD) shows how much oxygen microorganisms use to break down organic matter in water. It’s a key way to check how polluted water is and how well it’s being treated.
BOD Measurement Basics:
- Standard Test: BOD₅ (5-day test at 20°C)
- Formula: BOD₅ = [DO₀ – DO₅] × Dilution Factor
- DO₀ = Initial dissolved oxygen
- DO₅ = Dissolved oxygen after 5 days
Typical BOD Values:
- Raw municipal sewage: 200-300 mg/L
- Primary treated effluent: 120-150 mg/L
- Secondary treated effluent: 20-30 mg/L
- Tertiary treated effluent: <10 mg/L
High BOD levels indicate intense organic pollution requiring intense biological treatment, while low levels indicate good removal of organic compounds or toxic conditions inhibiting biological activity.
COD: The Comprehensive Oxidizable Material Measure
Chemical Oxygen Demand (COD) measures all chemically oxidizable substances in wastewater. It gives a more comprehensive view than BOD. This includes both biodegradable and non-biodegradable organic compounds.
COD Testing Advantages:
- Results available in 2-3 hours (vs. 5 days for BOD)
- Detects compounds that resist biological degradation
- Higher precision and reproducibility
COD Measurement Method:
The dichromate standard procedure oxidizes organic matter using potassium dichromate in strongly acidic medium with silver sulfate as a catalyst and in the presence of mercury sulfate to suppress interference by chlorides
COD:BOD Ratio Significance:
- COD:BOD ratio < 2: Easily biodegradable waste, suitable for biological treatment
- COD:BOD ratio 2-4: Moderately biodegradable, conventional biological treatment effective
- COD:BOD ratio > 4: Poor biodegradability, may require advanced oxidation processes
The ratio helps operators select appropriate treatment technologies and identify possible industrial discharges that affect the efficiency of biological treatment.
TSS: The Visible Contaminant Metric
Total Suspended Solids (TSS) measures particles in water that can be caught by filters. These particles include silt, clay, algae, organic matter, and microorganisms.
TSS Impacts on Treatment:
- High TSS clogs pipes, pumps, and membranes
- Increases chlorine demand for disinfection
- Reduces UV disinfection effectiveness
- Creates oxygen demand during decomposition
- Forms excessive sludge requiring disposal
TSS Measurement:
- Filter a known volume of sample through a pre-weighed filter
- Dry the filter at 103-105°C
- Weigh the filter again
- Calculate TSS = (Final weight – Initial weight) ÷ Sample volume × 1,000,000
TSS Removal Efficiency:
TSS Removal (%) = [(Influent TSS – Effluent TSS) ÷ Influent TSS] × 100
Tracking removal efficiency helps evaluate clarifier performance, filtration effectiveness, and overall solids management.
TDS: The Dissolved Constituents Challenge
Total Dissolved Solids (TDS) measures all inorganic and organic substances dissolved in water, passing through a 2-micron filter. These substances include minerals, salts, metals, and dissolved organic compounds.
TDS Components:
- Inorganic salts (calcium, magnesium, potassium, sodium, bicarbonates, chlorides, sulfates)
- Small amounts of organic matter
- Dissolved gases
TDS Measurement Methods:
- Conductivity Method: Quick estimation using electrical conductivity (EC)
- TDS (mg/L) ≈ EC (μS/cm) × conversion factor (typically 0.55-0.7)
- Gravimetric Method: Filter, evaporate, and weigh (more accurate but time-consuming)
TDS Impact on Treatment:
- High TDS can inhibit biological treatment processes
- Limits water reuse applications
- Increases corrosion potential
- Affects taste of treated water
- May require specialized removal technologies (RO, ion exchange)
Critical Parameter Relationships and Interpretation
The BOD-COD Connection
The relationship between BOD and COD provides critical insights into wastewater treatability:
Interpreting BOD:COD Ratios:
| BOD:COD Ratio | Interpretation | Treatment Implications |
| >0.6 | Highly biodegradable | Conventional biological treatment effective |
| 0.3-0.6 | Moderately biodegradable | May require longer retention times |
| <0.3 | Poor biodegradability | Consider physical-chemical treatment |
Changes in this ratio over time often signal:
- Industrial discharge variations
- Toxic compounds inhibiting biological activity
- Treatment process inhibition
TSS and Turbidity Correlation
While TSS measures mass concentration of particles, turbidity measures light scattering by particles. The parameters are connected but not identical:
• Correlation depends on particle size, shape, and composition
• Site-specific relationships should be established
• Quick turbidity readings may provide instant estimates of TSS following correlation with TSS
This association enables real-time process control decision-making based on turbidity as a TSS estimate when immediate data are needed.
Parameter Interdependencies
Understanding how parameters influence each other enhances process control:
- High TSS → Elevated BOD/COD: Particulate organic matter contributes to oxygen demand
- High TDS → Reduced biological activity: Salt concentrations above certain thresholds inhibit microorganisms
- BOD:COD ratio shifts → Treatment efficacy changes: Decreasing ratio may indicate toxic inhibition
Smart operators utilize these relationships to diagnose problems before they affect compliance.
Practical Applications for Treatment Plant Operators
Case Study: Municipal STP Performance Optimization
A 5 MLD sewage treatment plant in Bangalore was facing variable BOD removal efficiency. Analysis revealed:
- Influent BOD: 280-350 mg/L
- COD:BOD ratio: 2.1-2.3
- TSS: 280-320 mg/L
- TDS: 800-950 mg/L
By implementing continuous parameter monitoring and process adjustments based on real-time data, the plant:
- Improved BOD removal efficiency from 85% to 92%
- Reduced energy consumption by 12%
- Decreased chemical usage by 18%
- Stabilized operations despite influent variations
Parameter-Based Process Control Strategies
Effective operators utilize parameter measurement to guide operating decisions:
BOD Control:
•Adjust F:M (food-to-microorganism) ratio based on influent BOD
•Modulate aeration rates to tie in with organic loading
•Control return activated sludge rates to optimize MLSS concentration
TSS Management:
•Optimize coagulant/flocculant dosing based on influent TSS
•Adjust clarifier operating parameters (sludge blanket depth, retention time)
•Resume filtration as necessary to meet discharge standards
TDS Challenges:
•Employ blending techniques for high-TDS streams
•Side-stream treatment to minimize TDS
• Track biological processes for salt inhibition.
Troubleshooting Using Parameter Data
Challenge 1: Fluctuating BOD Removal Efficiency
Symptoms:
• Variable BOD removal during stable operations
• Deterioration of secondary clarifier effluent quality
Parameter-Based Diagnosis:
• Monitor BOD:COD ratio changes (potential toxicity indicator)
• Check for MLSS and F:M ratio variations
• Check influent TDS for inhibitor levels
Solutions:
• Employ equalization tanks to buffer load variations
• Adjust waste activated sludge rates to maintain optimum sludge age
• Implement advanced biological treatment technologies for variable loads
Challenge 2: High Effluent TSS
Symptoms:
• Elevated effluent TSS under normal operations
• Excessive clarifier carry-over
Parameter-Based Diagnosis:
• Track influent TSS and removal efficiencies along treatment train
• Check sludge volume index (SVI) for evidence of bulking
• Compare clarifier loading rates with design parameters
Solutions:
• Optimize coagulant/polymer dosage for improved flocculation
• Begin microscopic analysis for filamentous organisms
• Tertiary filtration for effluent polishing may need to be considered
Challenge 3: TDS Breakthrough in Treated Water
Symptoms:
• Elevated effluent TDS affecting reuse applications
• Increasing conductivity of treated water
Parameter-Based Diagnosis:
• Track TDS sources and seasonal trends
• Track levels of specific ions (chlorides, sulfates)
• Evaluate TDS impact on biological treatment efficacy
Solutions:
• Source control of high-TDS inputs
• Reverse osmosis for critical applications
• Ion exchange for selective ion removal
Advanced Monitoring and Management Approaches
Online Monitoring Systems
Modern treatment plants now use online analyzers for real-time monitoring:
Available Technologies:
- BOD estimation: UV-Vis spectrophotometry correlations
- COD monitoring: UV absorbance and TOC correlations
- TSS measurement: Optical sensors (light scattering)
- TDS tracking: Conductivity meters with temperature compensation
Implementation Benefits:
- Early detection of treatment issues
- Process automation opportunities
- Reduced laboratory testing costs
- Better compliance management
- Historical data for trend analysis
These systems are costly but offer quick returns on investment. They improve operations and reduce risks.
Data-Driven Decision Making
Effective parameter management starts with understanding data:
- Statistical Process Control (SPC): Set normal ranges for each parameter
- Trend Analysis: Spot gradual changes that show problems are coming
- Correlation Studies: Connect different parameters to how well a process works
- Predictive Models: Guess what challenges might come up based on what’s coming in
This way of analyzing data turns raw numbers into useful insights for running things better.
Future Trends in Parameter Monitoring
Emerging Technologies
The water treatment industry is always changing with new ways to monitor water:
- Biosensors: Quick BOD checks in just minutes with microbial fuel cells
- AI-Driven Analytics: Smart models predict changes and improve treatment
- Internet of Things (IoT): Smart sensors connect for full plant checks
- Molecular Methods: DNA tests quickly find specific pollutants
- Microfluidic Devices: Small lab tools analyze many things at once
These new tools mean we can check water faster, more accurately, and in more detail.
Regulatory Evolution
Treatment plant operators should get ready for changes in rules:
- More attention on tiny pollutants beyond usual checks
- Stricter limits for common pollutants
- More focus on constant monitoring instead of one-time tests
- New rules for pollutants like PFAS and medicines
- More information needed and shared with the public
Keeping up with these changes helps maintain long-term success and stability.
Regulatory Compliance and Reporting
Parameter Limits by Application
Different discharge scenarios have varying parameter requirements:
| Application | BOD Limit | COD Limit | TSS Limit | TDS Considerations |
| Surface water discharge | <10-30 mg/L | <50-250 mg/L | <20-100 mg/L | Site-specific |
| Irrigation reuse | <100 mg/L | <250 mg/L | <100 mg/L | Crop tolerance |
| Groundwater recharge | <10 mg/L | <50 mg/L | <10 mg/L | Aquifer protection |
| Industrial reuse | Application-specific | Application-specific | <10-50 mg/L | Process compatibility |
Always consult current CPCB and state PCB guidelines, as regulations continue to evolve.
Compliance Documentation Best Practices
Maintaining proper records is key for following the rules:
- Implement standardized testing protocols with quality control
- Document all sampling locations, methodologies, and chain of custody
- Maintain calibration records for all measurement equipment
- Create statistical process control charts for parameter tracking
- Prepare contingency plans for parameter excursions
This documentation acts as a shield during regulatory checks. It shows you operate professionally.
Practical Tips for Treatment Plant Operators
Optimizing Parameter Testing Programs
Develop an inexpensive but comprehensive test program:
- Prioritize parameters based on compliance risk and process control value
- Establish correlations between parameters to reduce testing burdens
- Combine grab and composite sampling strategically
- Implement field testing for rapid operational decisions
- Develop site-specific normal ranges for each parameter
This inexpensive plan provides necessary data without excessive laboratory cost.
Staff Training on Parameter Significance
Make sure all staff know how important each parameter is:
- Train operators on how parameters work together
- Make simple guides for common situations
- Use visual boards to show current parameter levels
- Hold regular sessions to share knowledge on trends
- Get operators involved in testing and sampling
Well-trained staff are key in preventing problems with parameters.
Conclusion: Mastering Water Quality Parameters
Understanding and managing BOD, COD, TSS, and TDS are key for running a successful treatment plan. These factors affect how well the plant works ( its costs and its reliability). They also help meet legal standards.
By using the right monitoring and management methods, operators can turn data into useful actions. This helps keep the plant running smoothly. It also warns of problems early, so they can be fixed quickly.
As new technologies and rules come in, managing these parameters will become even more critical. Operations teams should look into new ways to monitor and control these factors. This will help them stay ahead of challenges.
Work with wastewater treatment experts to find solutions that fit your plant’s needs. With good parameter management, treatment plants can perform at their best. They can also meet legal standards and stay sustainable for a long time.
Resources for Treatment Plant Operators
Essential Reference Materials
- Standard Methods for the Examination of Water and Wastewater (APHA/AWWA/WEF)
- CPCB Guidelines for Water Quality Monitoring
- Industrial Wastewater Treatment Process Design Guidelines
Useful Formulas
- F:M Ratio = BOD Load (kg/day) ÷ MLSS (kg)
- Sludge Age (days) = Total MLSS (kg) ÷ Waste Activated Sludge (kg/day)
- Oxygen Transfer Efficiency = Oxygen Transferred ÷ Oxygen Applied × 100
Online Resources
- Water Environment Federation Technical Resources
- International Water Association Knowledge Hub
- Regional PCB Compliance Guidelines
You may like these also: